

The Challenge
STAP—Technical Advisory Panel to the Global Environment Facility, has been helping developing countries with implementing chemical conventions and additional environmental agreements (the so-called GEF Projects).
STAP has provided me with several figures, each illustrating a particular issue relating to the environmental pollution to be included in the especially prepared background report. I’ve been commissioned to simplify the figures in order to make the information they contain easier to absorb and to enhance their visual appeal. The target audience would be people knowledgeable of the environmental issues (i.e. regulators), but not necessarily scientists with a background in chemistry.
STAP has provided me with several figures, each illustrating a particular issue relating to the environmental pollution to be included in the especially prepared background report. I’ve been commissioned to simplify the figures in order to make the information they contain easier to absorb and to enhance their visual appeal. The target audience would be people knowledgeable of the environmental issues (i.e. regulators), but not necessarily scientists with a background in chemistry.
Slides provided by the STAP team
The Approach
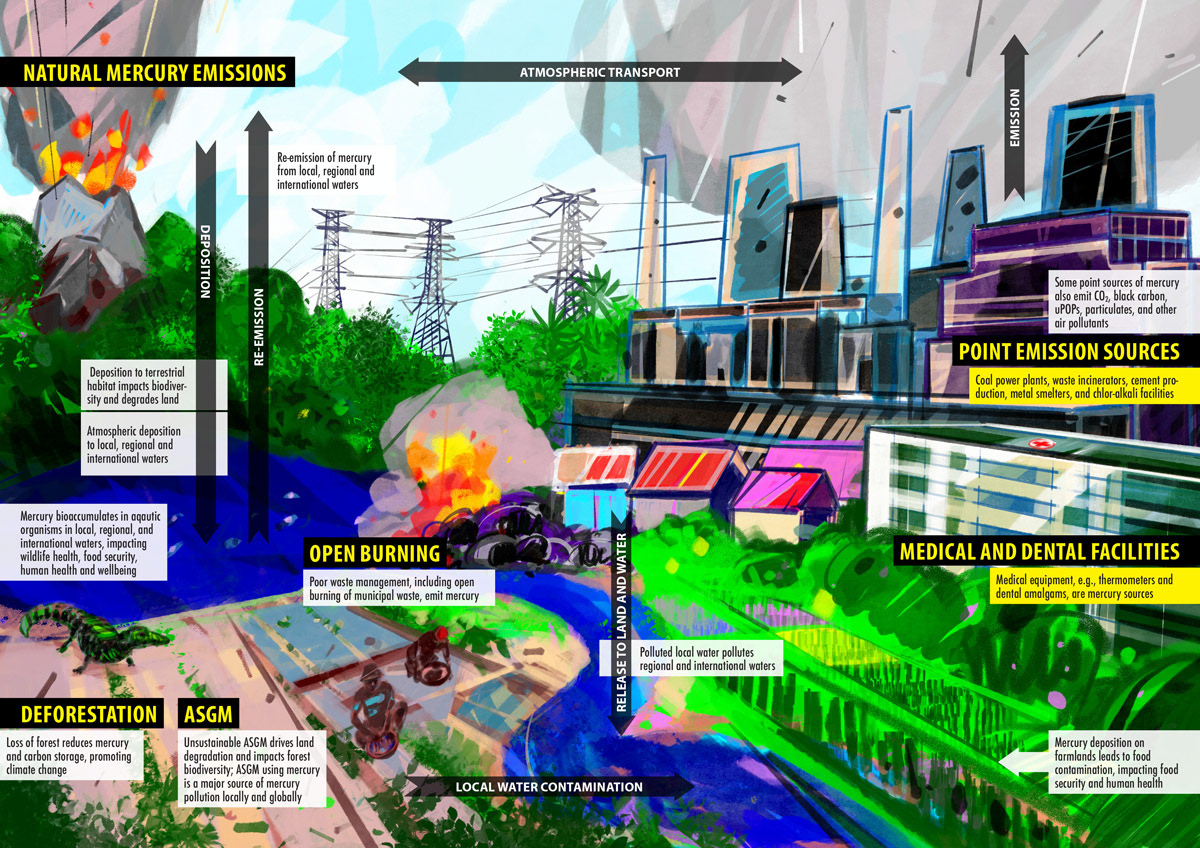
To ensure maximum flexibility and appealing effect, all illustrations have been hand-drawn on an iPad. Each illustration required creating a coherent visual narrative and an easily recognisable hierarchy that would help the reader better understand the interconnectedness of the undesirable substances present in the environment and their persistent resurfacing.

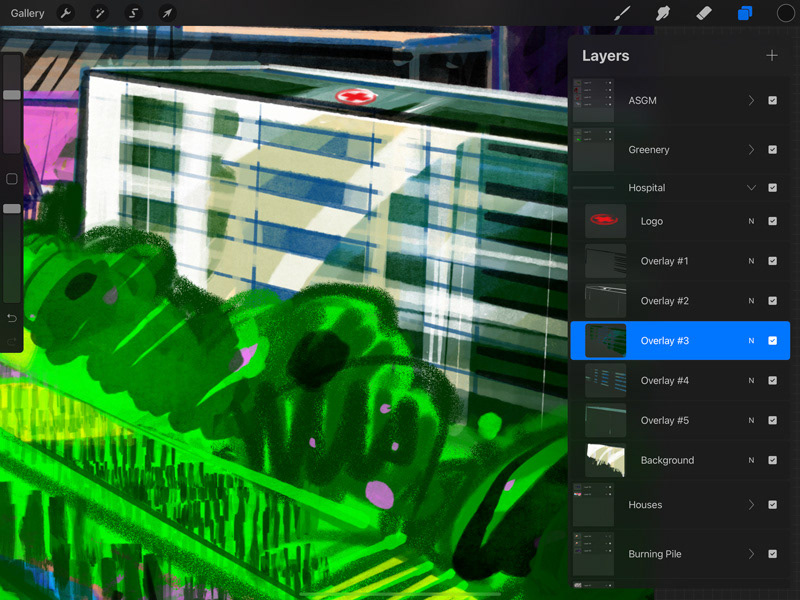
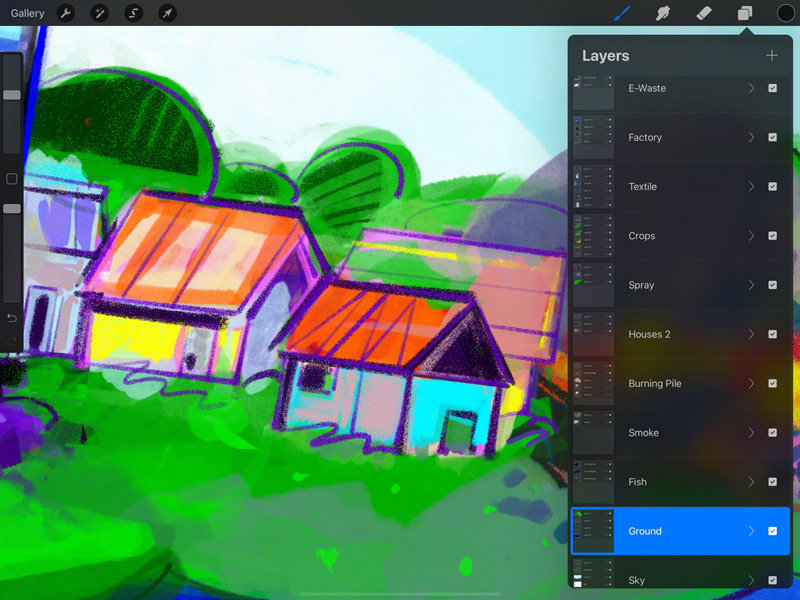
In the initial sketches, I’ve concentrated on identifying the main pollution sources. Once I had that in place, I’ve proceeded with creating an all-encompassing setting, that would visually hold together these central components. In the end, we’ve managed to cut down the amount of arrows and other unnecessary distractions. The labels have also been abbreviated and their content simplified.
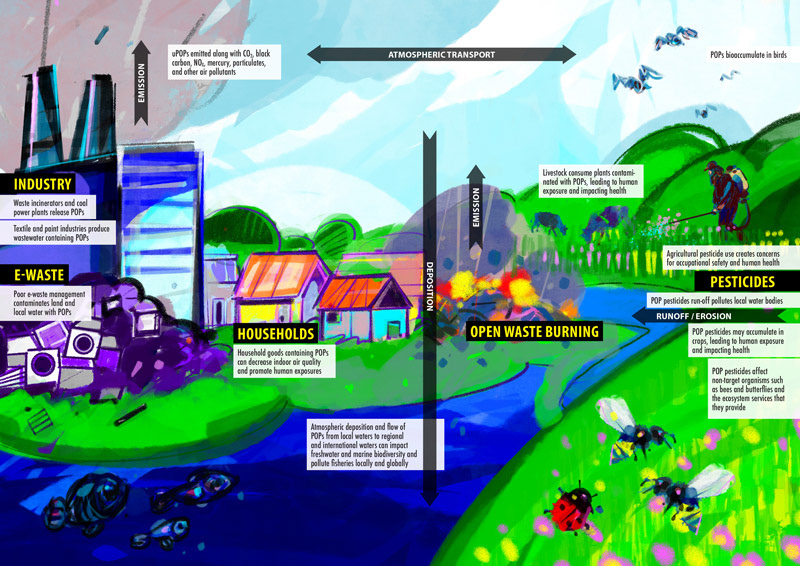
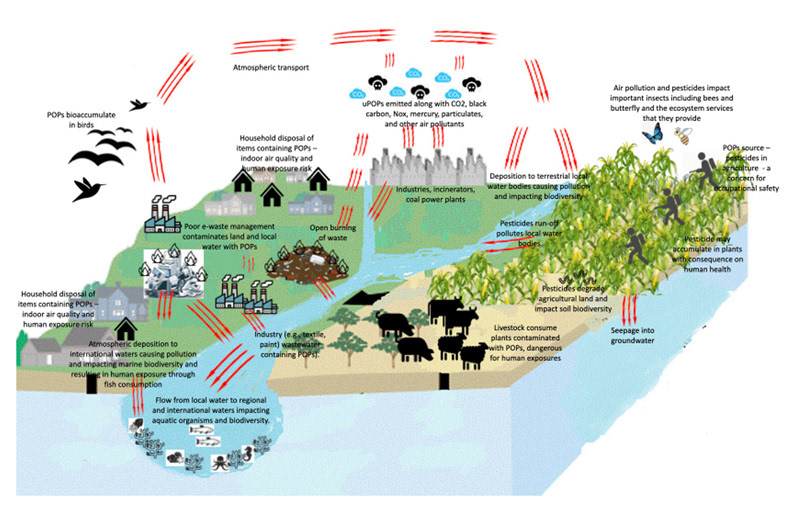
POPs - Persistent Organic Pollutants: Work progress
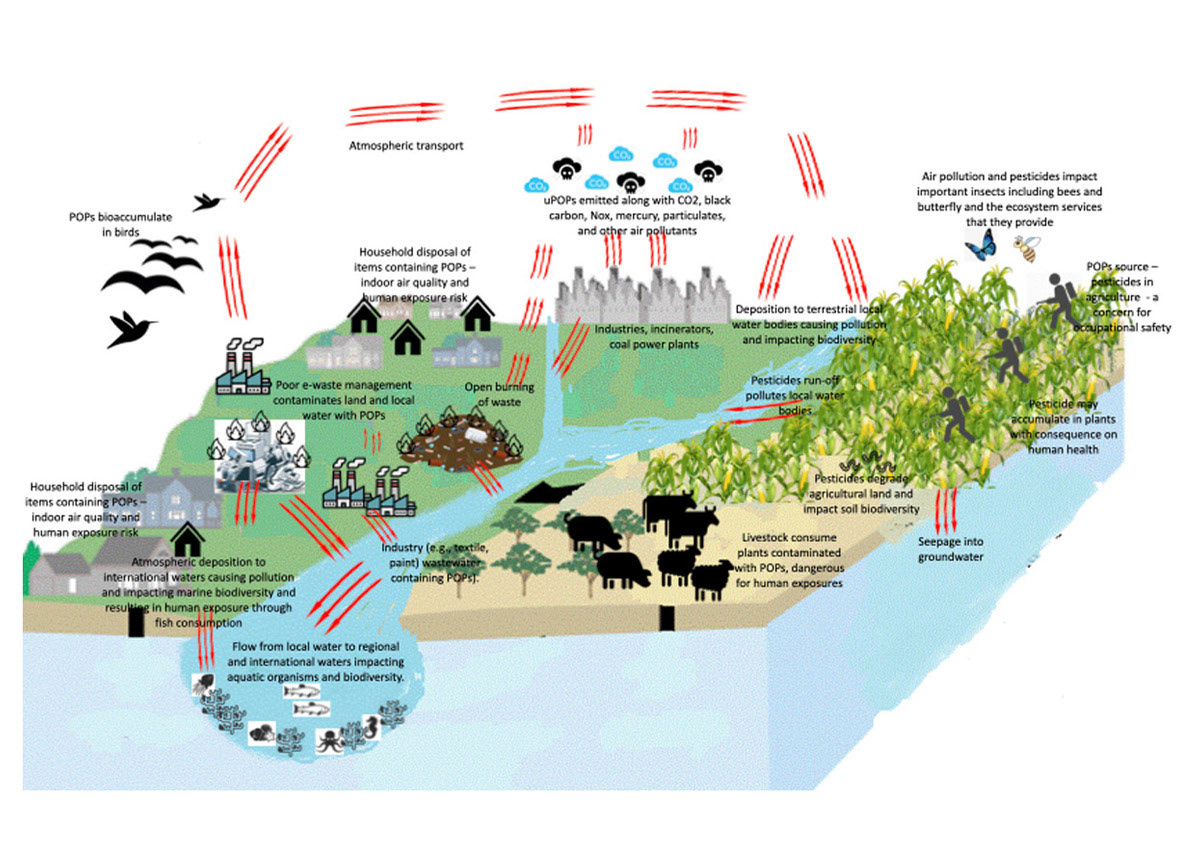
Slide provided by STAP
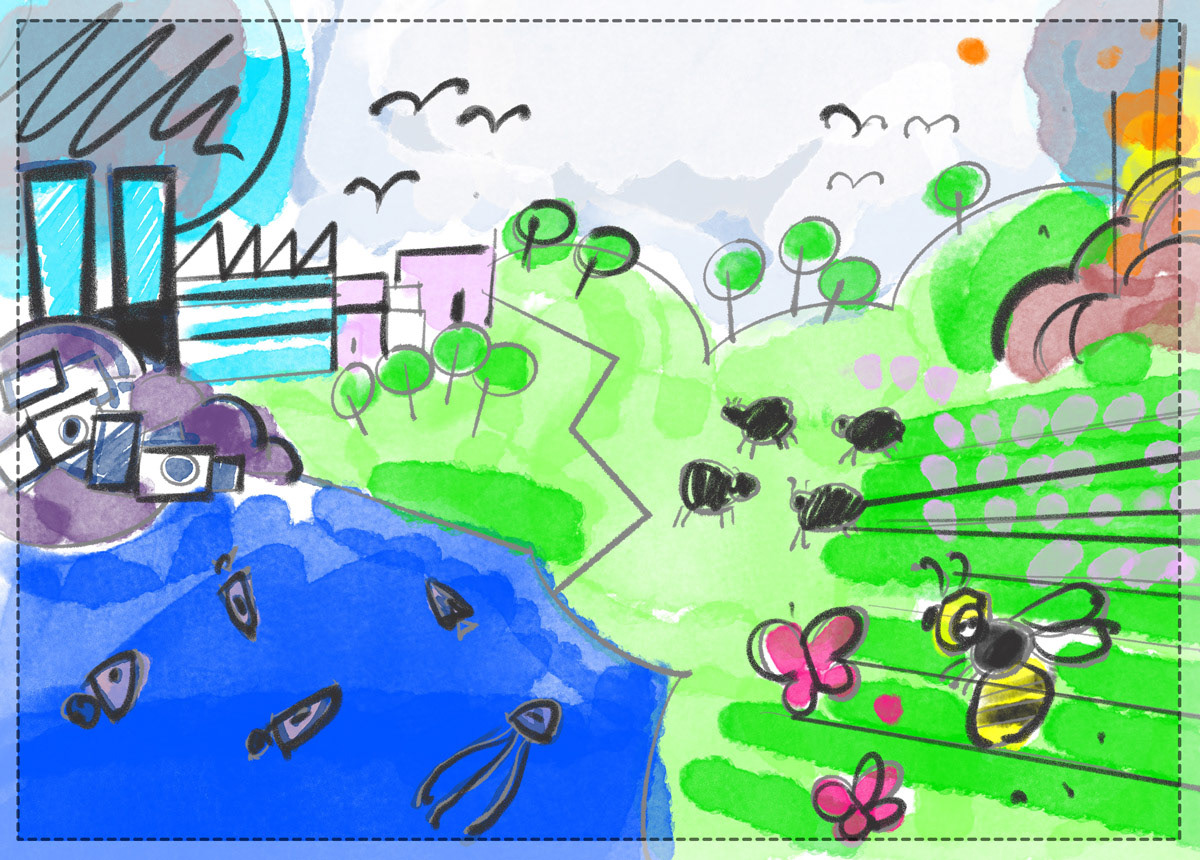
Initial draft (composition)
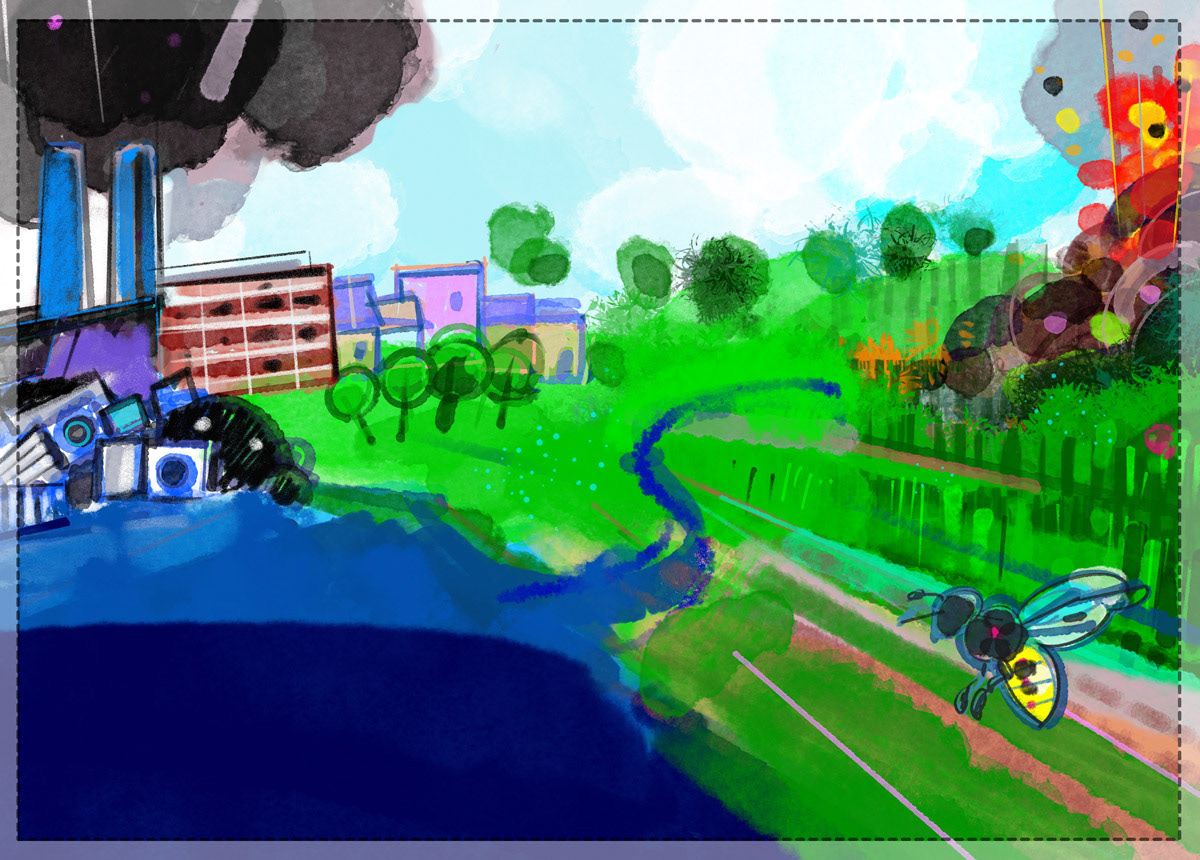
Advanced draft (details)
First release candidate
Accepted illustration
End Result with labels

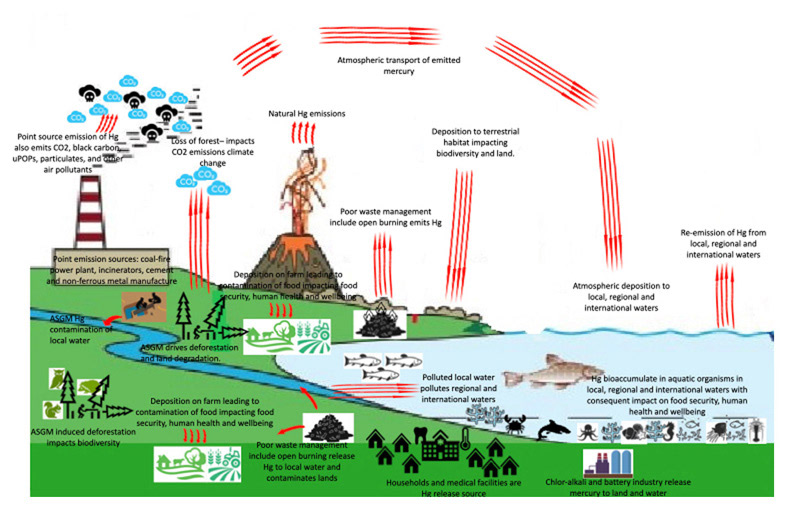
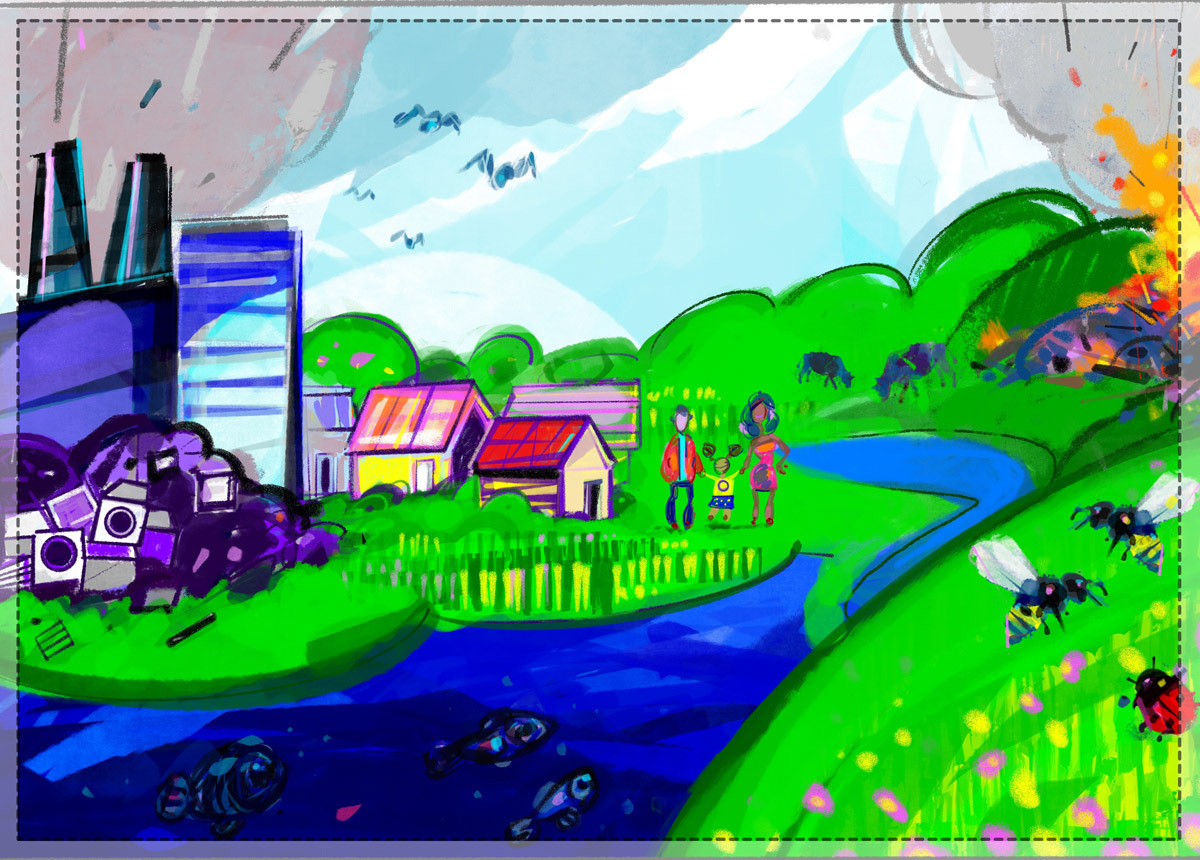
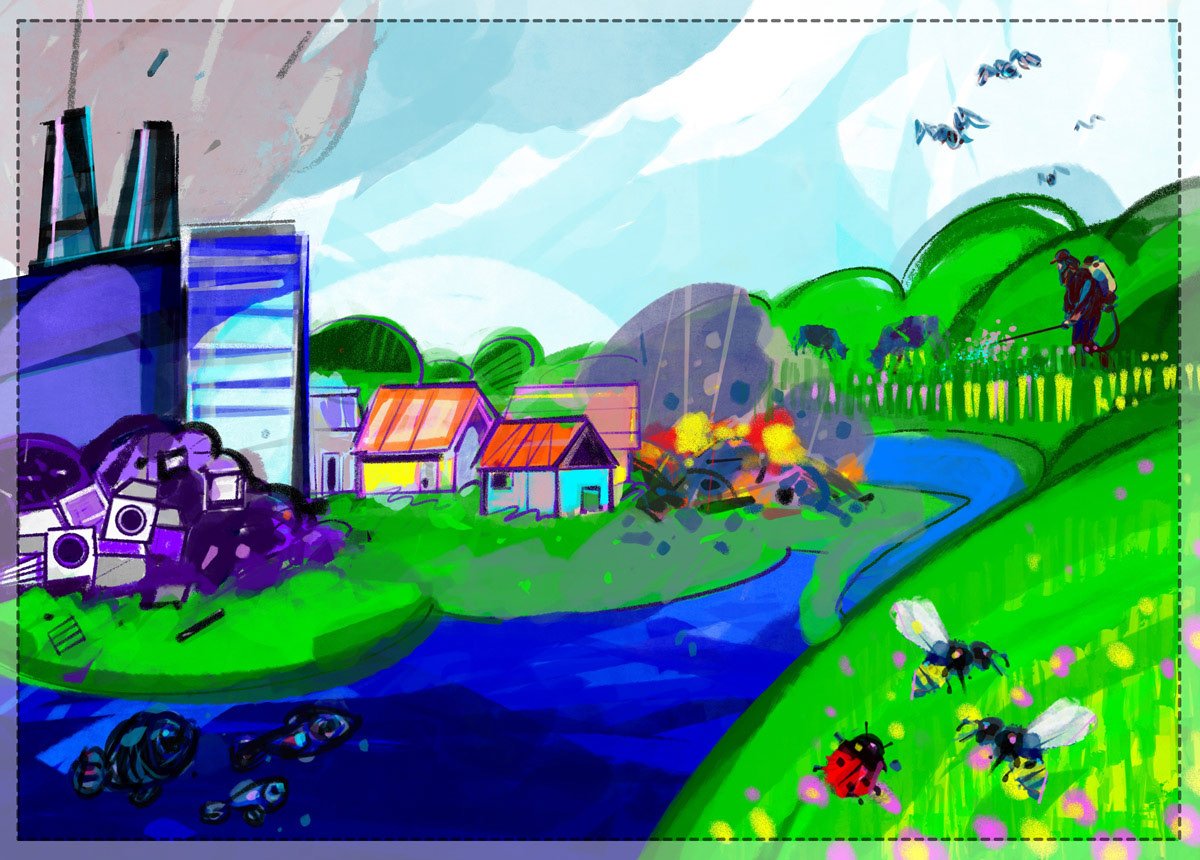
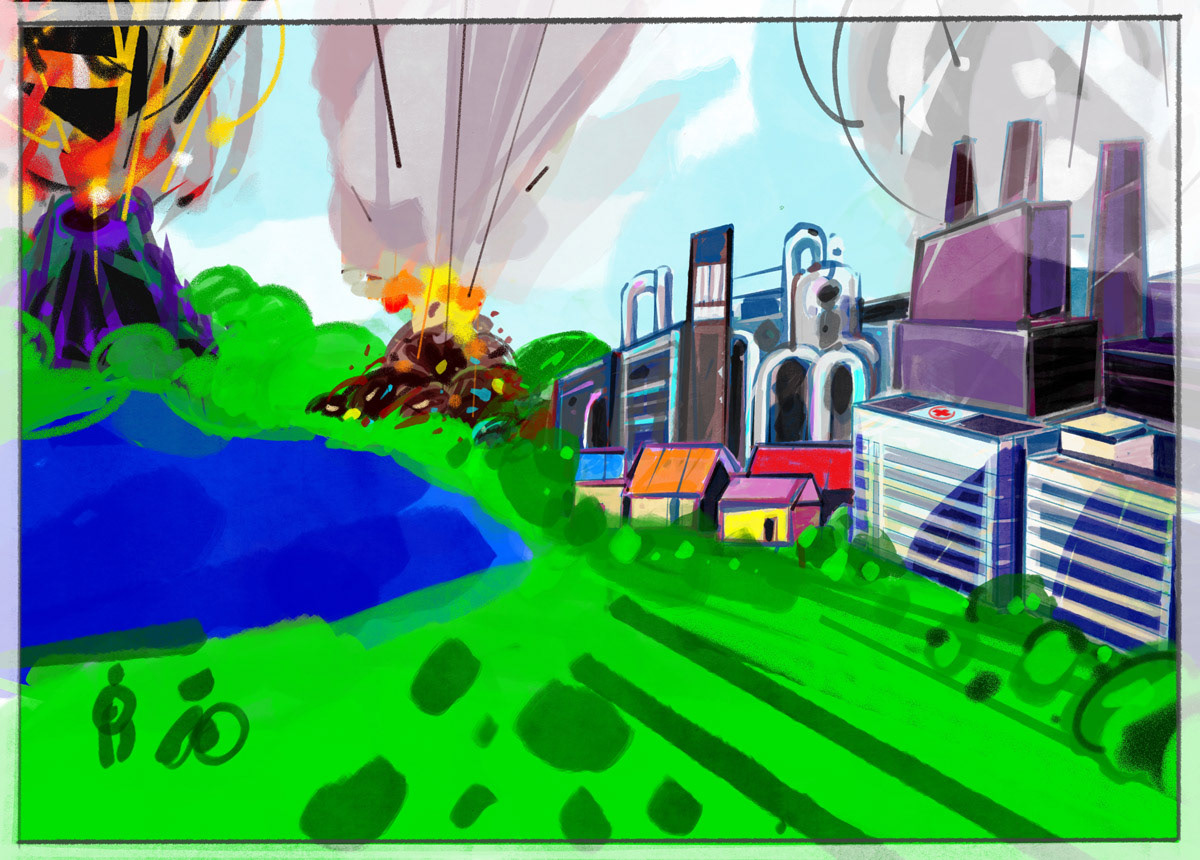
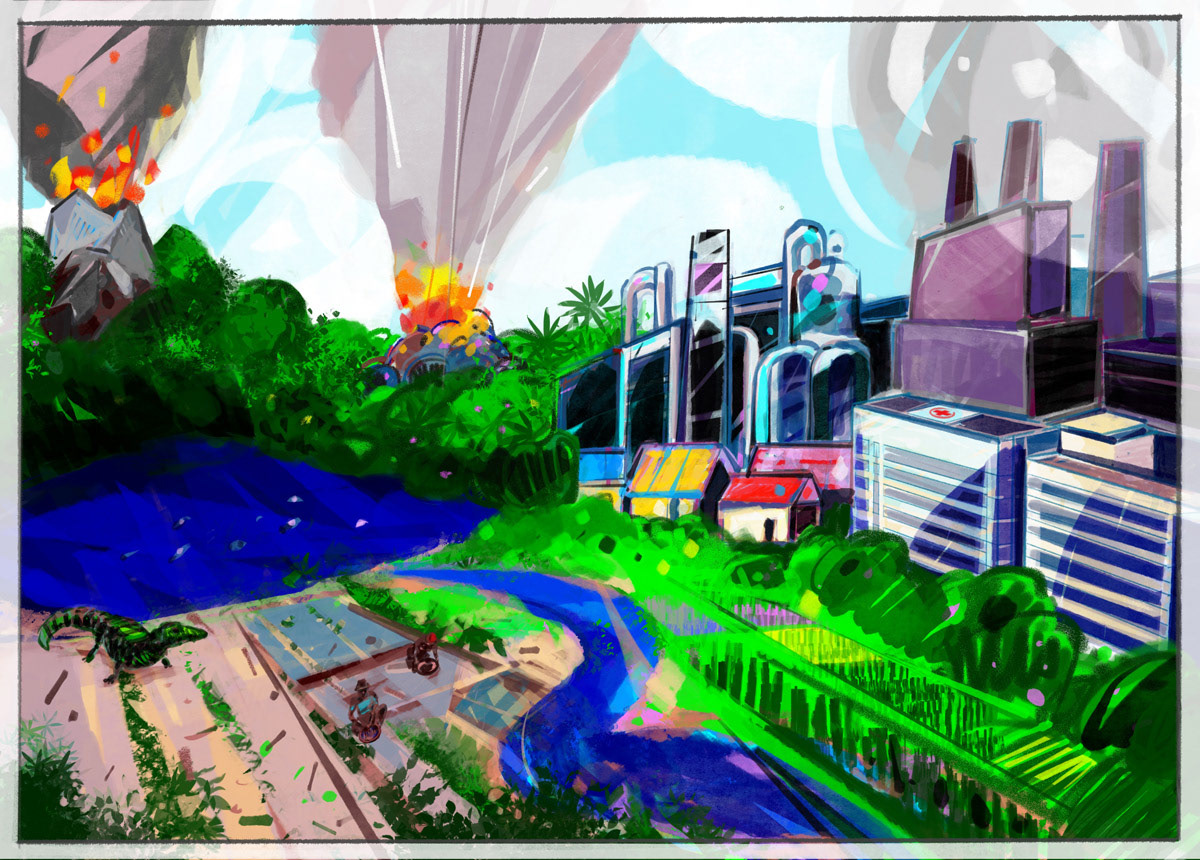
Mercury Pollution
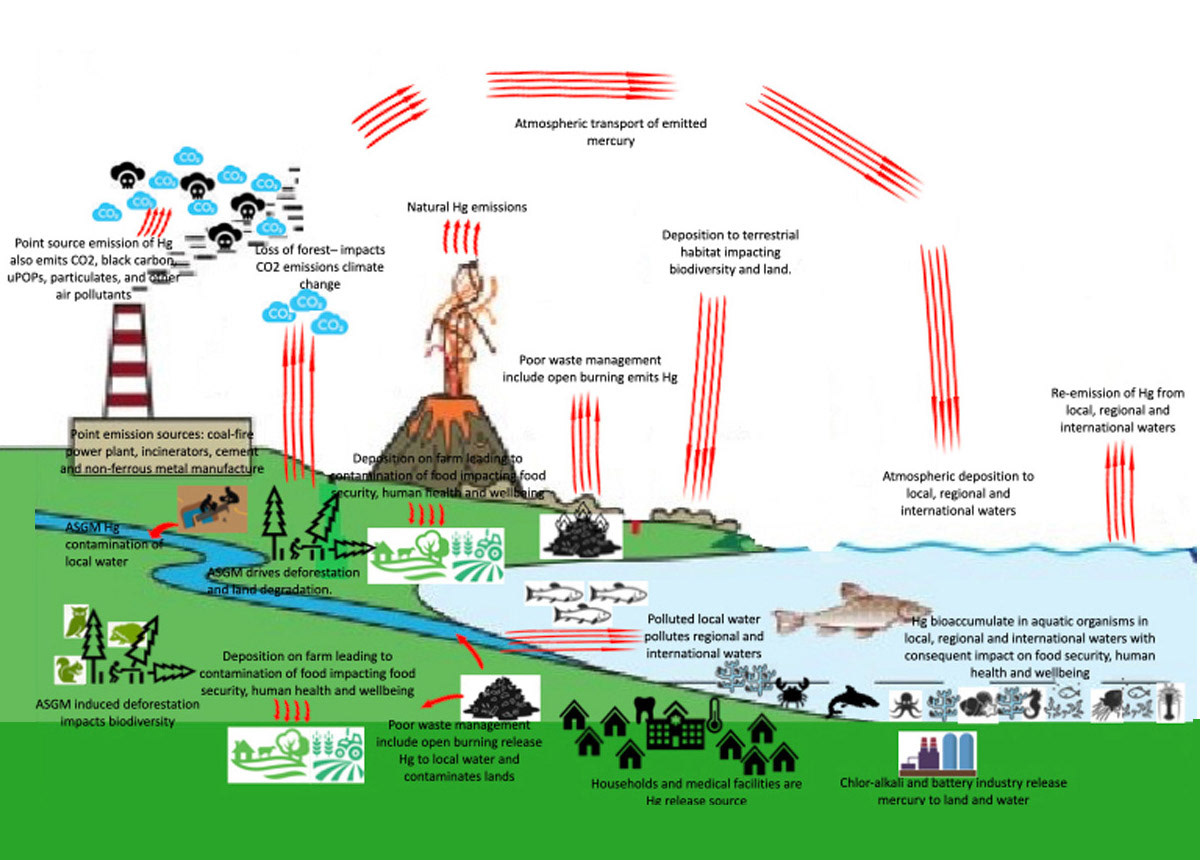
Slide provided by STAP
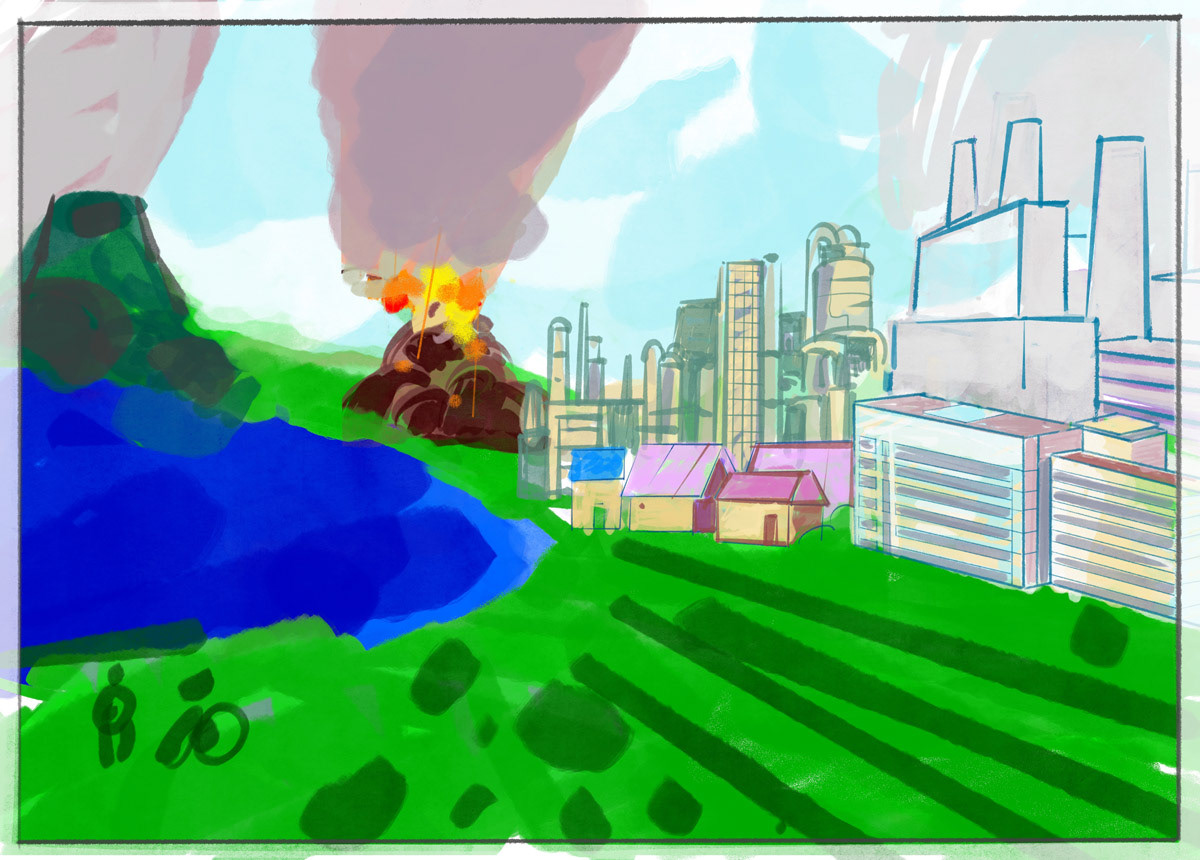
First draft (composition)
Advanced draft (placement)
Release candidate
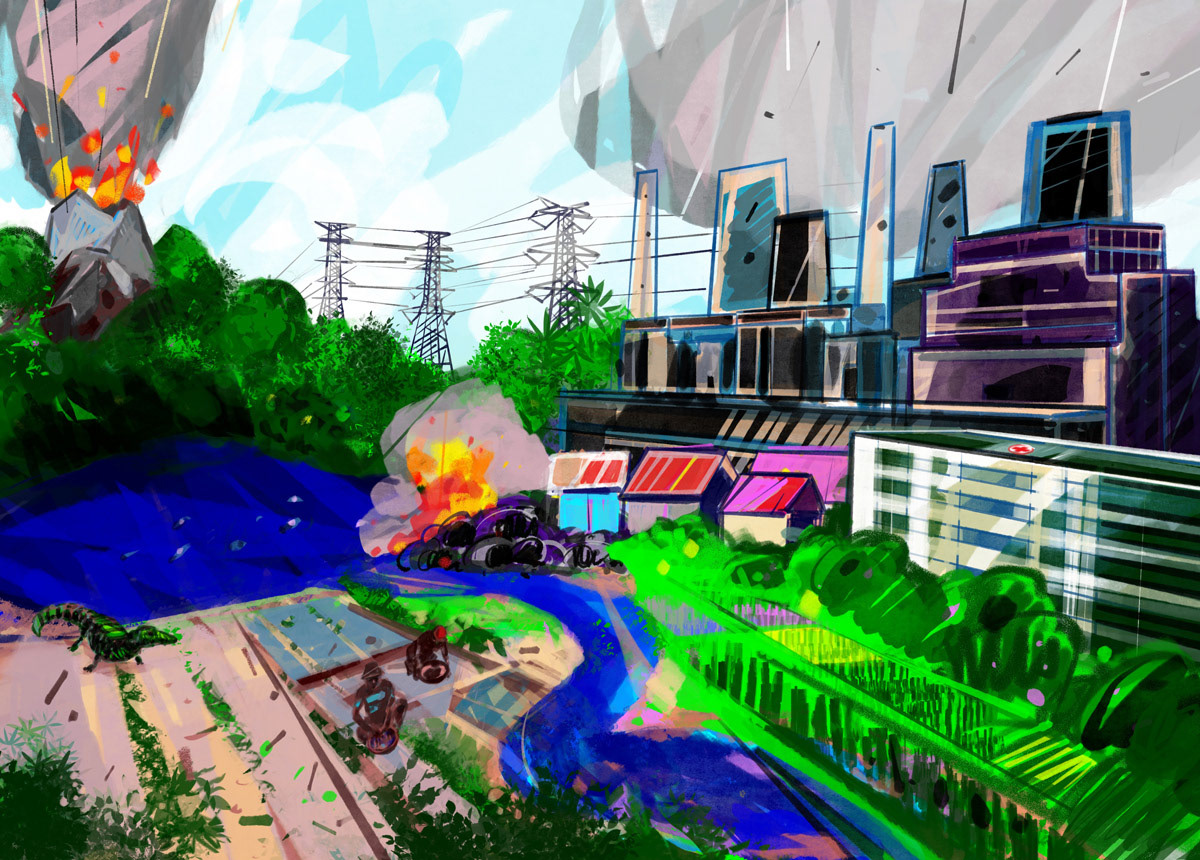
Accepted illustration
End Result with labels
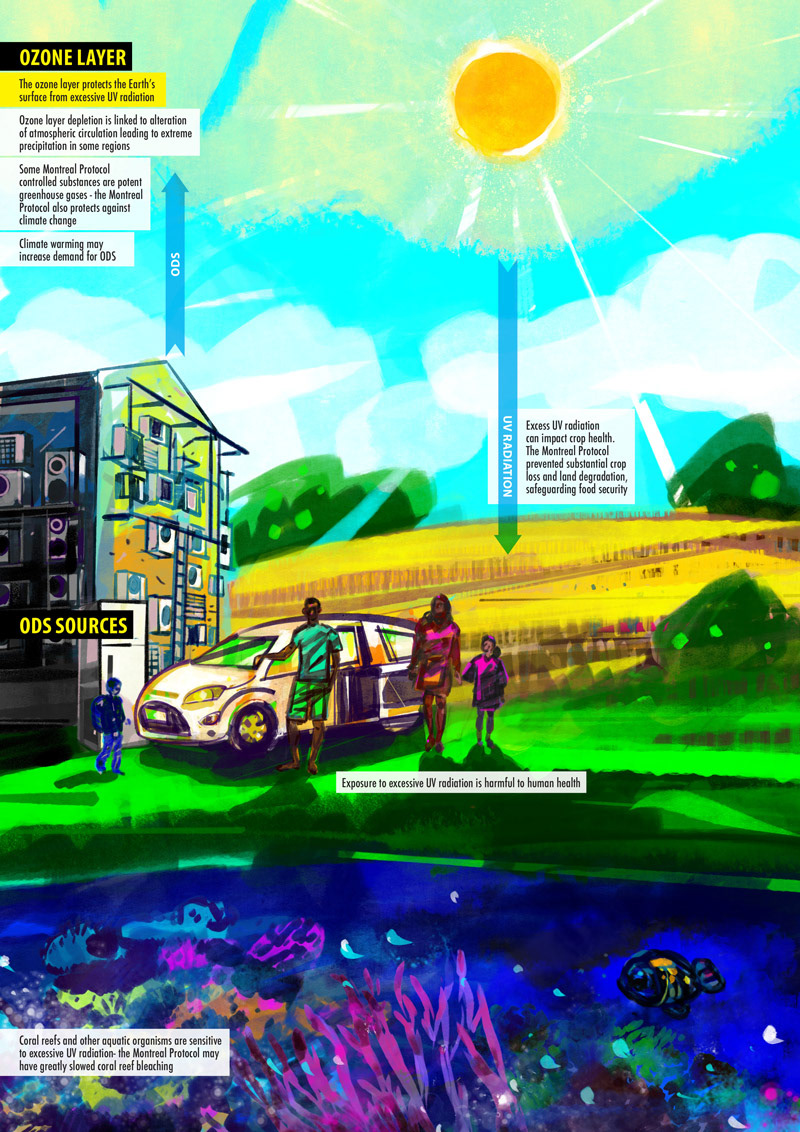
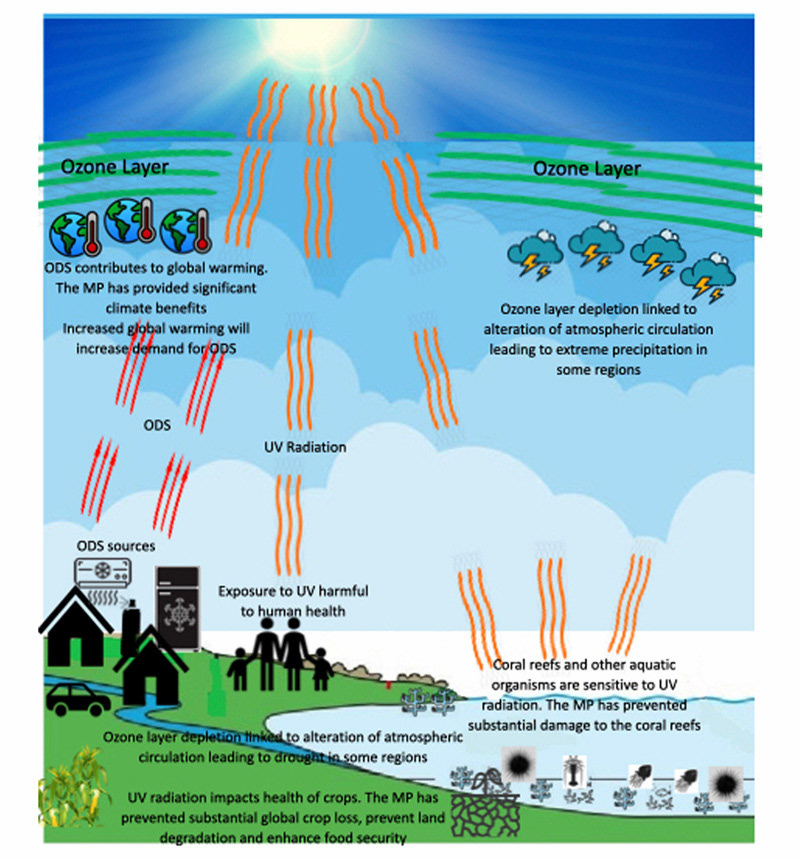
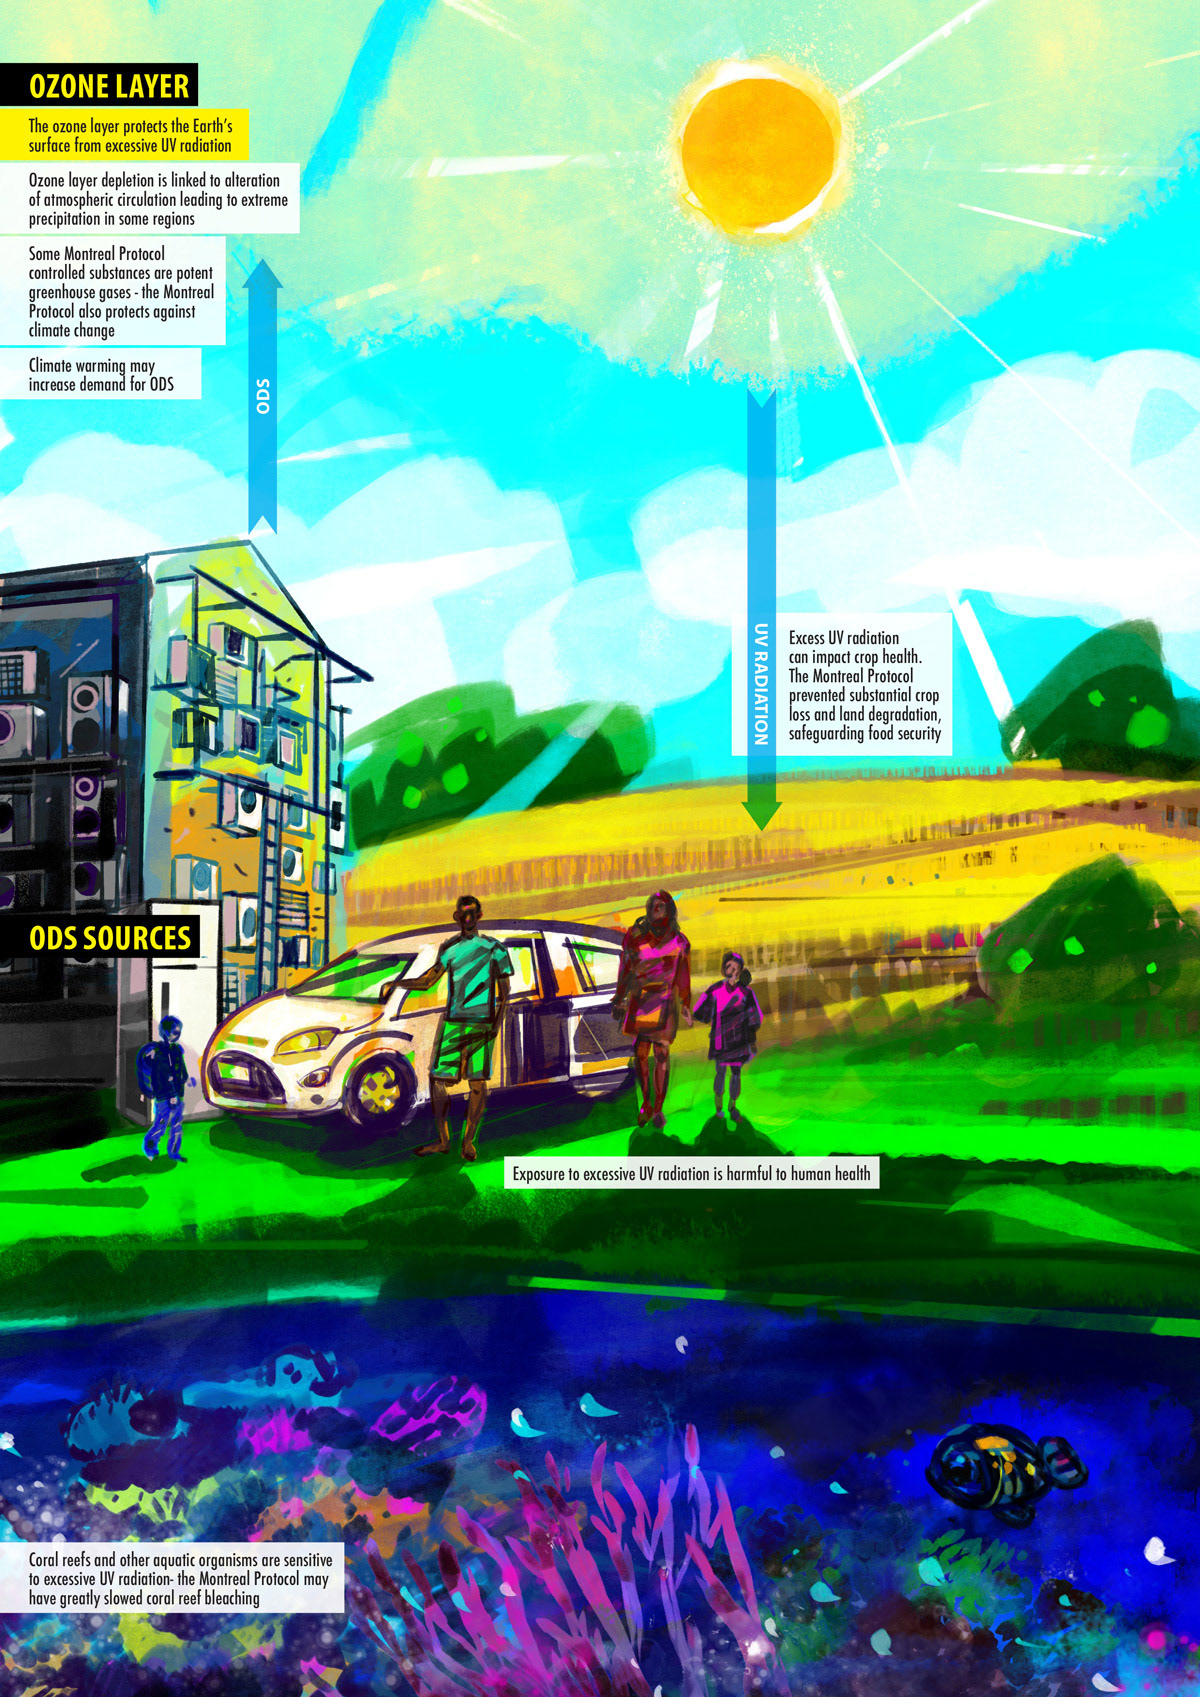
Ozone Depletion
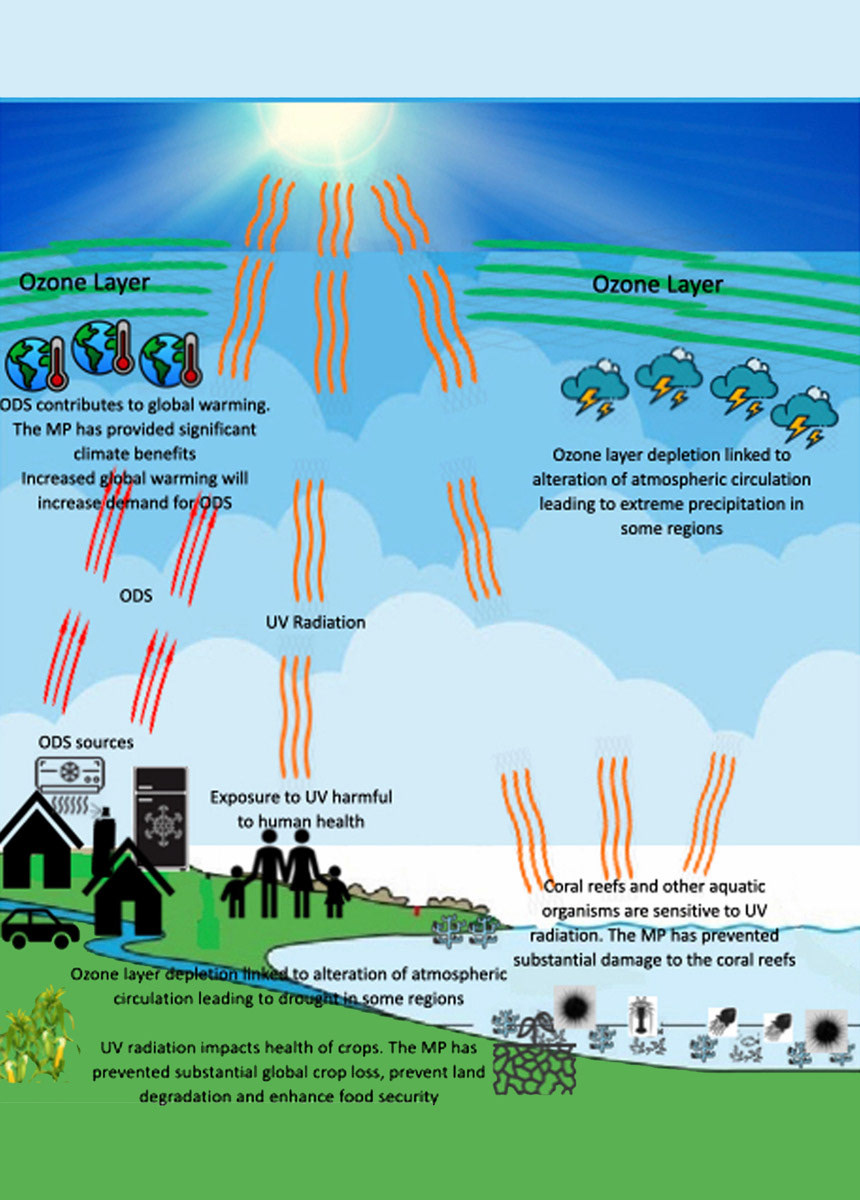
Slide provided by STAP
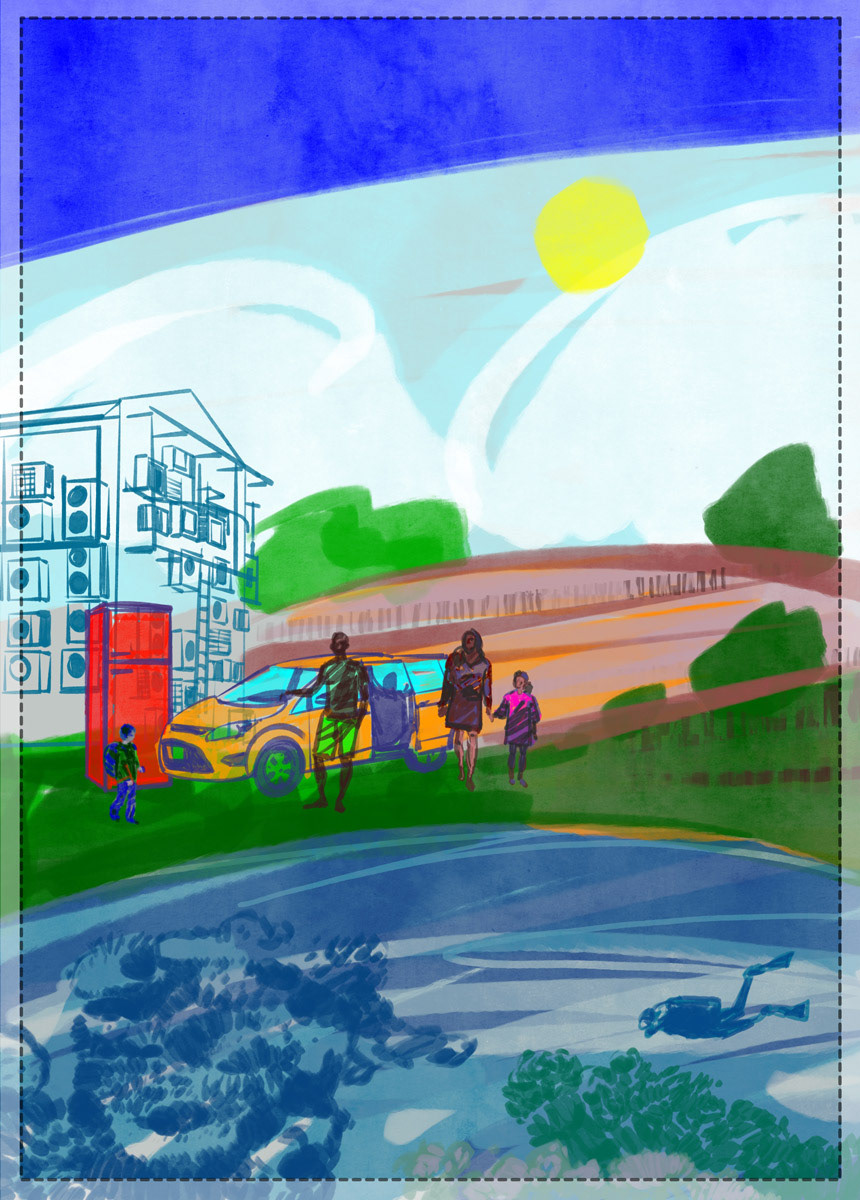
First draft
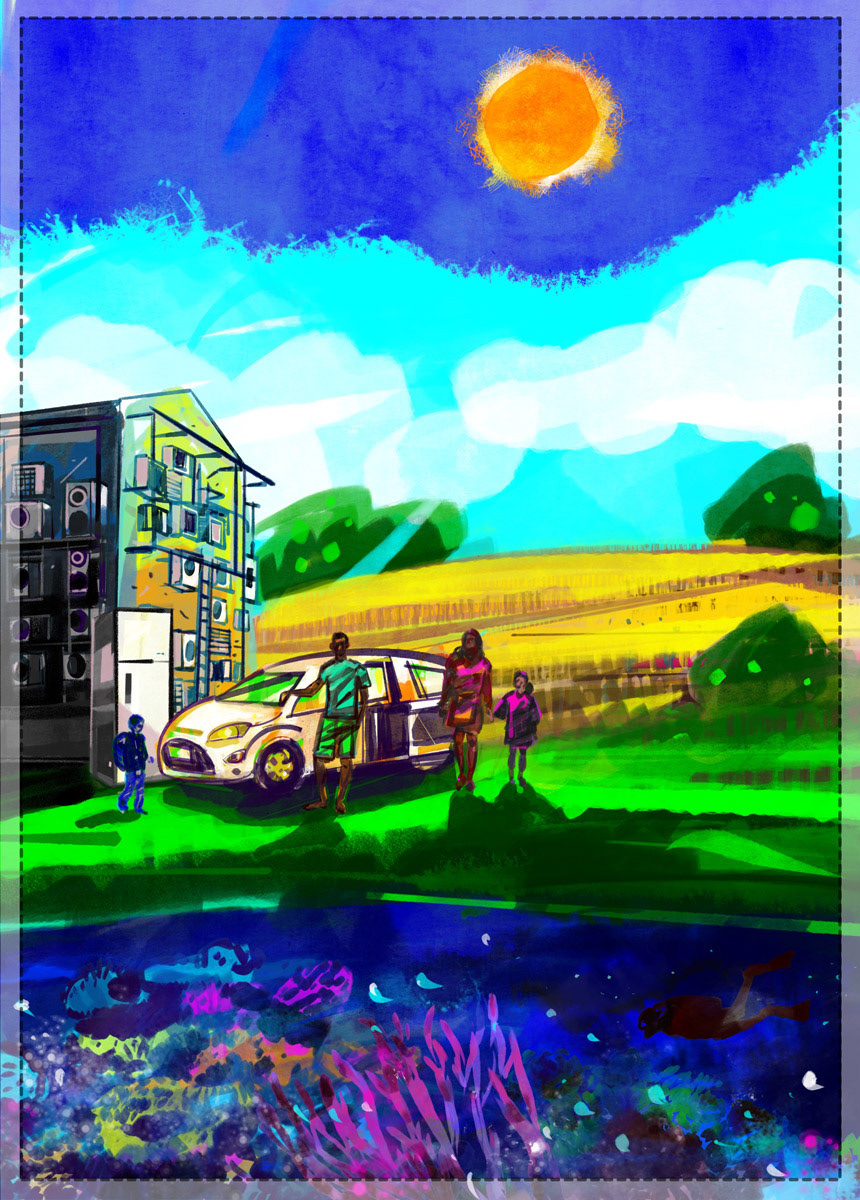
Advanced draft
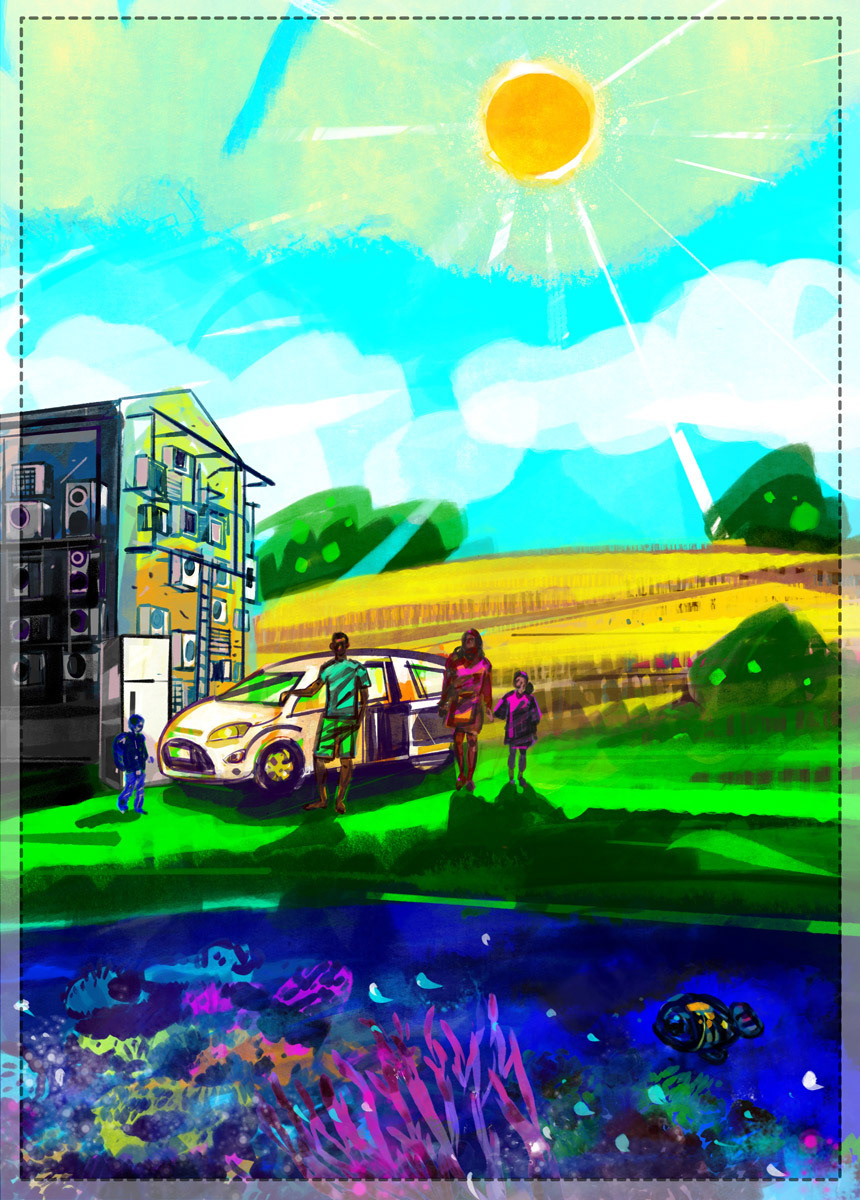
Accepted illustration
End Result with labels
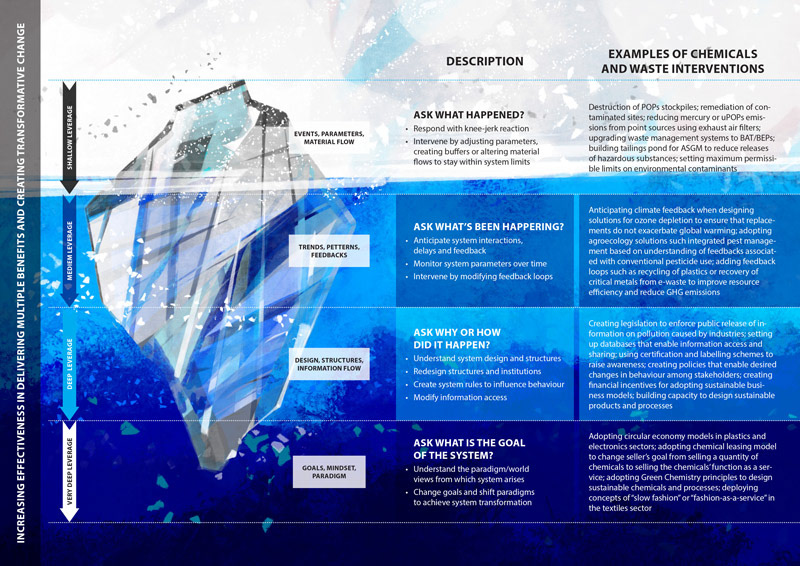
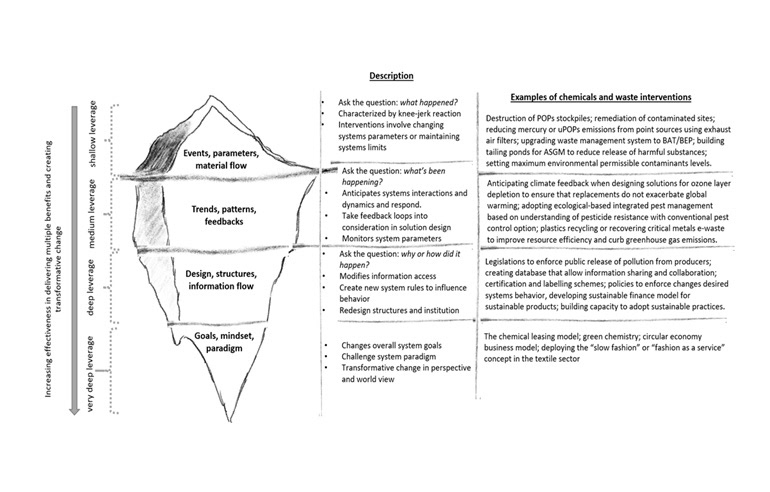
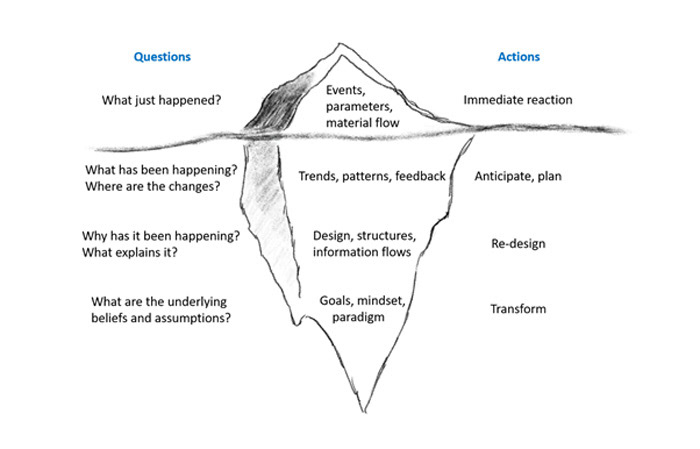
Iceberg Figure 01
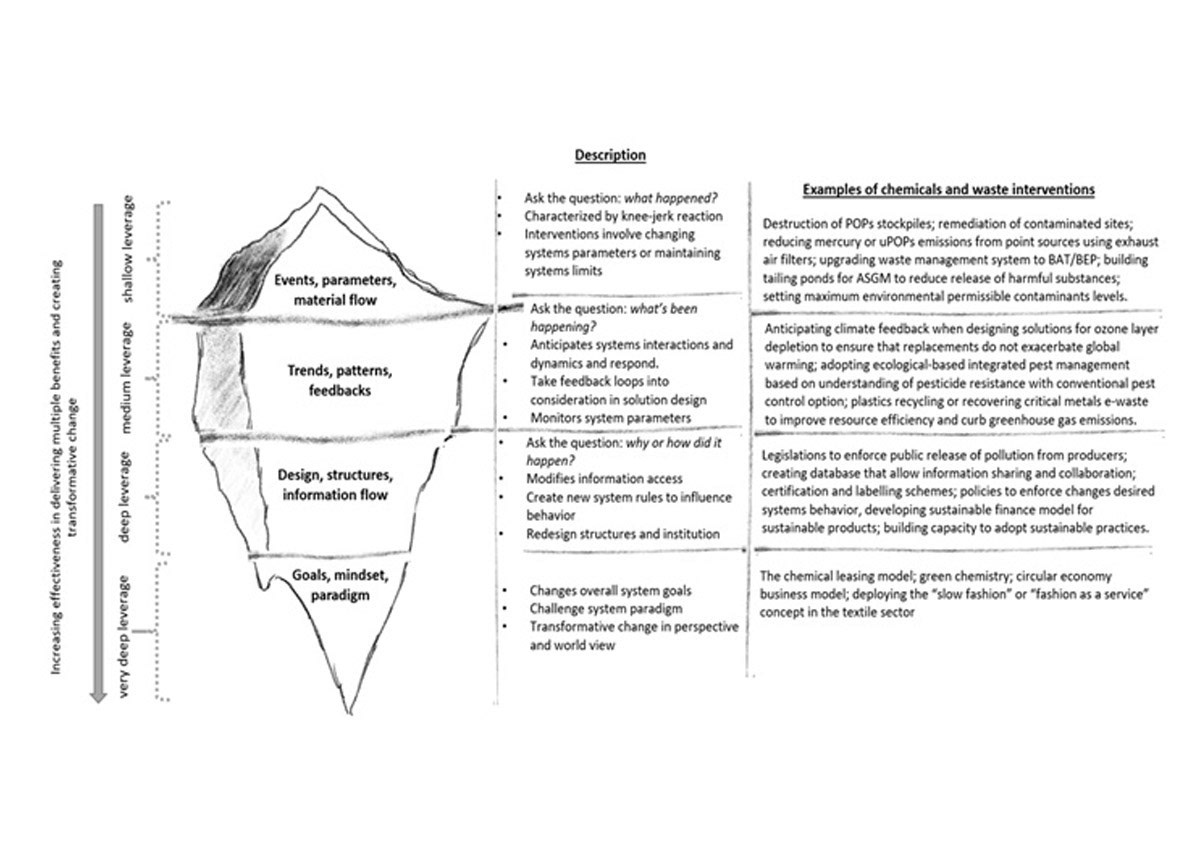
Slide provided by STAP
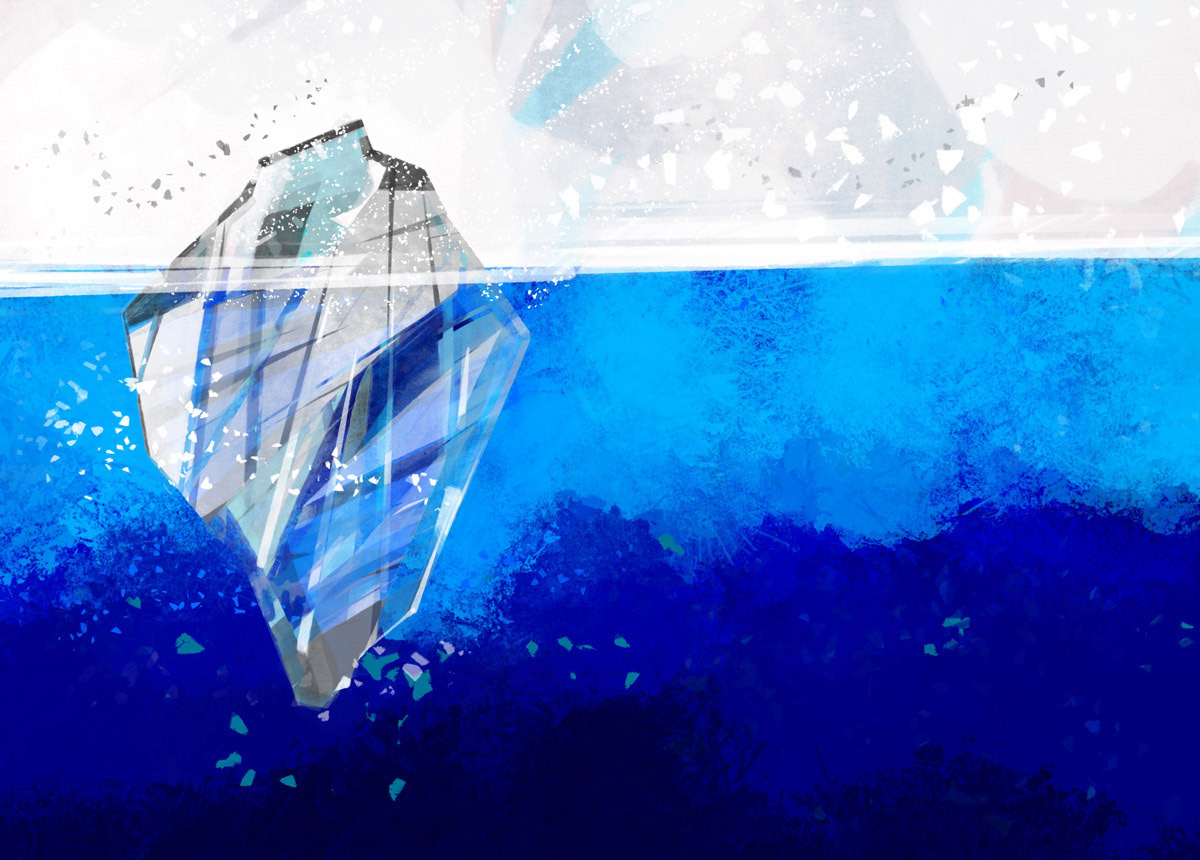
Illustration without labels

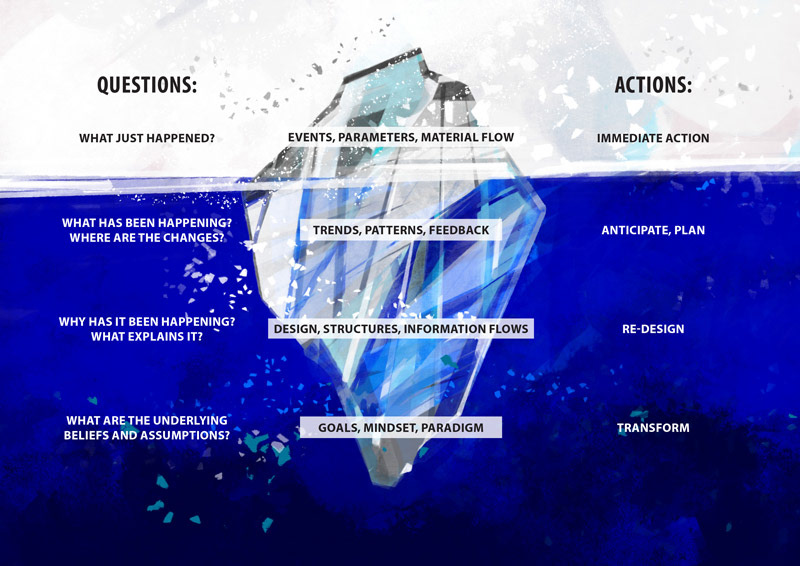
Iceberg Figure 02
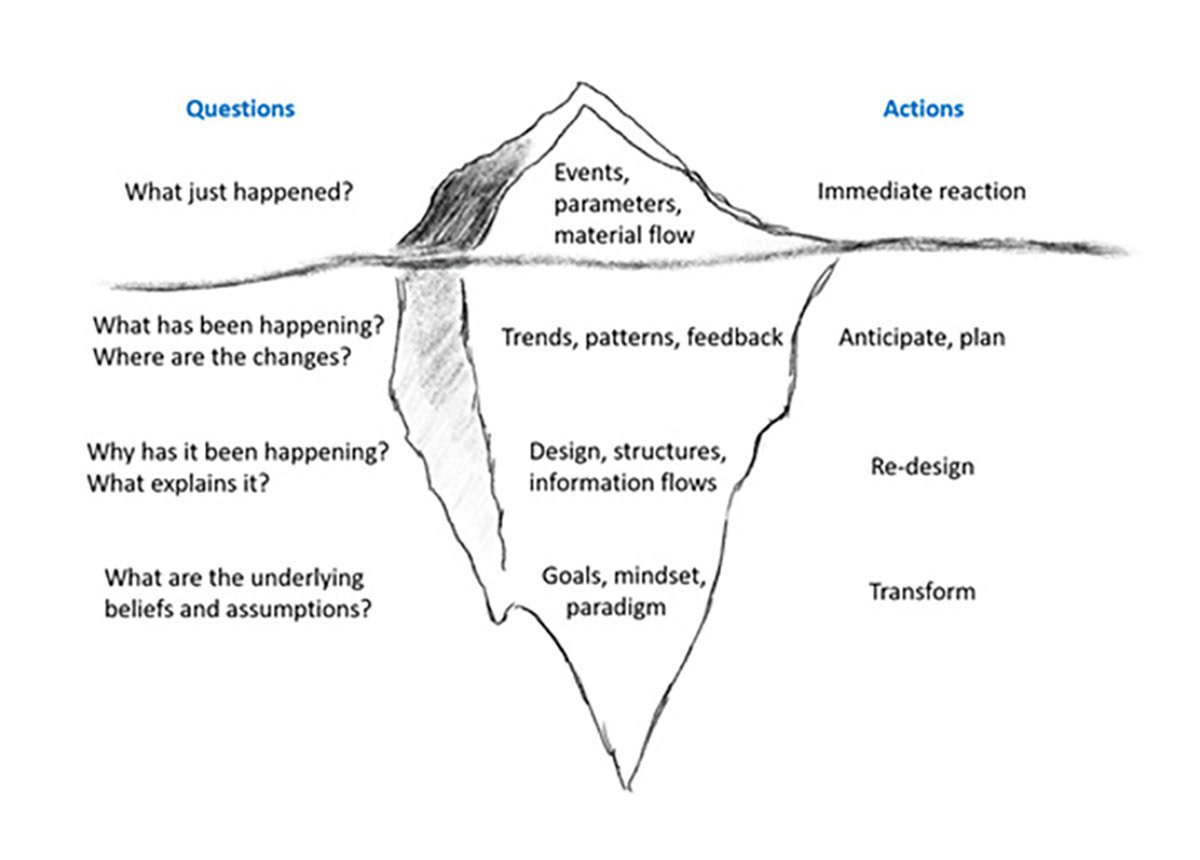
Slice provided by STAP
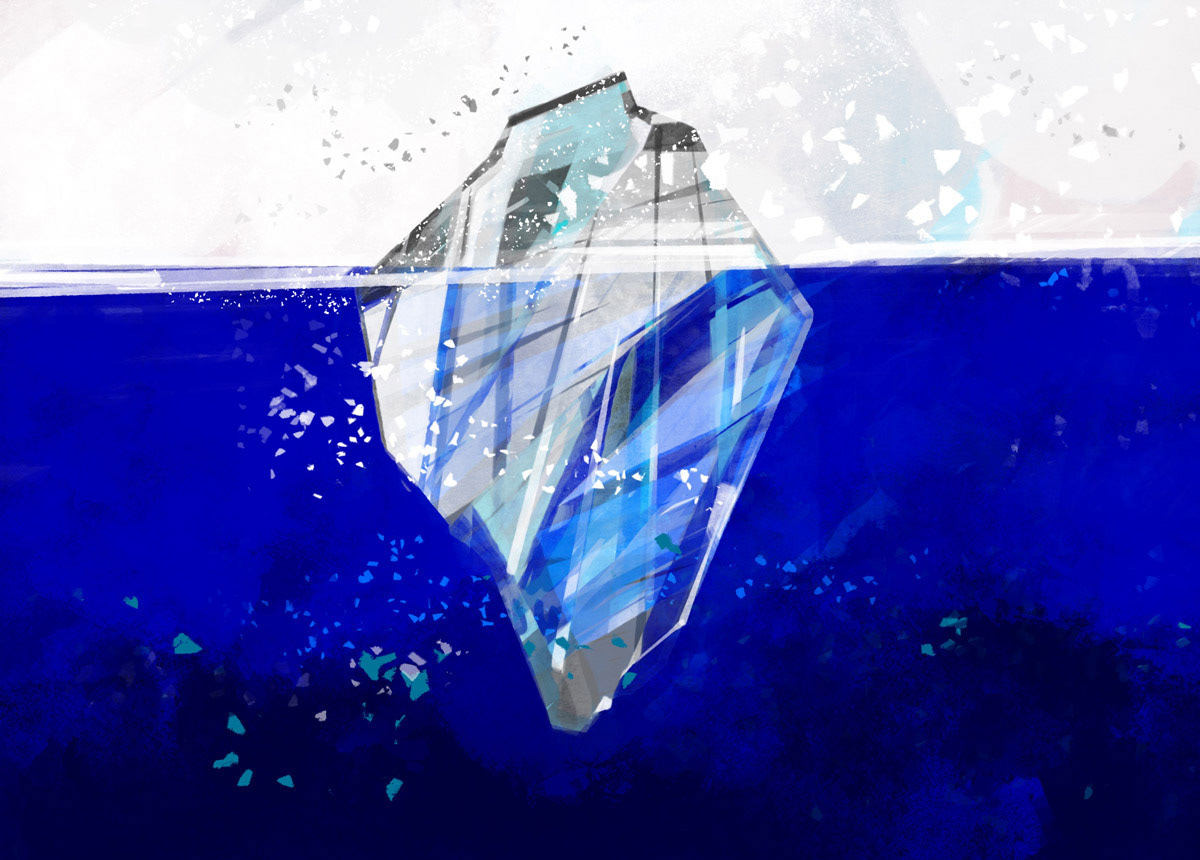
Illustration without labels
